---
title: Debug ASP.NET Core Blazor WebAssembly
author: guardrex
description: Learn how to debug Blazor apps.
monikerRange: '>= aspnetcore-3.1'
ms.author: riande
ms.custom: mvc
ms.date: 03/26/2020
no-loc: [Blazor, SignalR]
uid: blazor/debug
---
# Debug ASP.NET Core Blazor WebAssembly
[Daniel Roth](https://github.com/danroth27)
[!INCLUDE[](~/includes/blazorwasm-preview-notice.md)]
Blazor WebAssembly apps can be debugged using the browser dev tools in Chromium-based browsers (Edge/Chrome). Alternatively you can debug your app using Visual Studio or Visual Studio Code.
Available scenarios include:
* Set and remove breakpoints.
* Run the app with debugging support in Visual Studio and Visual Studio Code (F5 support).
* Single-step (F10) through the code.
* Resume code execution with F8 in a browser or F5 in Visual Studio or Visual Studio Code.
* In the *Locals* display, observe the values of local variables.
* See the call stack, including call chains that go from JavaScript into .NET and from .NET to JavaScript.
For now, you *can't*:
* Inspect arrays.
* Hover to inspect members.
* Step debug into or out of managed code.
* Have full support for inspecting value types.
* Break on unhandled exceptions.
* Hit breakpoints during app startup.
* Debug an app with a service worker.
We will continue to improve the debugging experience in upcoming releases.
## Prerequisites
Debugging requires either of the following browsers:
* Microsoft Edge (version 80 or later)
* Google Chrome (version 70 or later)
## Enable debugging for Visual Studio and Visual Studio Code
Debugging is enabled automatically for new projects that are created using the ASP.NET Core 3.2 Preview 3 or later Blazor WebAssembly project template.
To enable debugging for an existing Blazor WebAssembly app, update the *launchSettings.json* file in the startup project to include the following `inspectUri` property in each launch profile:
```json
"inspectUri": "{wsProtocol}://{url.hostname}:{url.port}/_framework/debug/ws-proxy?browser={browserInspectUri}"
```
Once updated, the *launchSettings.json* file should look similar to the following example:
[!code-json[](debug/launchSettings.json?highlight=14,22)]
The `inspectUri` property:
* Enables the IDE to detect that the app is a Blazor WebAssembly app.
* Instructs the script debugging infrastructure to connect to the browser through Blazor's debugging proxy.
## Visual Studio
To debug a Blazor WebAssembly app in Visual Studio:
1. Ensure you have [installed the latest preview release of Visual Studio 2019 16.6](https://visualstudio.com/preview) (Preview 2 or later).
1. Create a new ASP.NET Core hosted Blazor WebAssembly app.
1. Press F5 to run the app in the debugger.
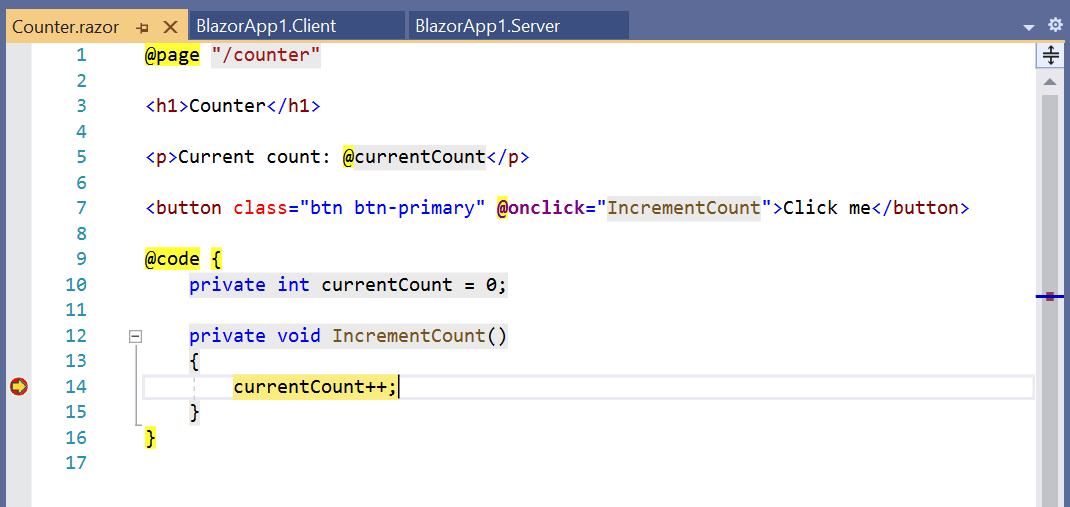
1. Set a breakpoint in *Counter.razor* in the `IncrementCount` method.
1. Browse to the **Counter** tab and select the button to hit the breakpoint:

1. Check out the value of the `currentCount` field in the locals window:

1. Press F5 to continue execution.
While debugging your Blazor WebAssembly app, you can also debug your server code:
1. Set a breakpoint in the *FetchData.razor* page in `OnInitializedAsync`.
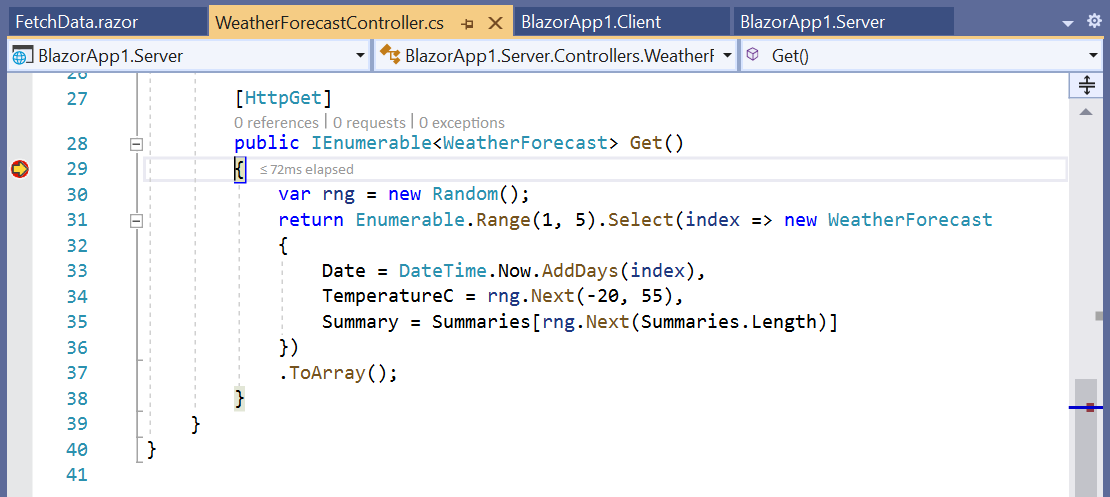
1. Set a breakpoint in the `WeatherForecastController` in the `Get` action method.
1. Browse to the **Fetch Data** tab to hit the first breakpoint in the `FetchData` component just before it issues an HTTP request to the server:

1. Press F5 to continue execution and then hit the breakpoint on the server in the `WeatherForecastController`:

1. Press F5 again to let execution continue and see the weather forecast table rendered.
## Visual Studio Code
To debug a Blazor WebAssembly app in Visual Studio Code:
1. Install the [C# extension](https://marketplace.visualstudio.com/items?itemName=ms-dotnettools.csharp) and the [JavaScript Debugger (Nightly)](https://marketplace.visualstudio.com/items?itemName=ms-vscode.js-debug-nightly) extension with `debug.javascript.usePreview` set to `true`.


1. Open an existing Blazor WebAssembly app with debugging enabled.
* If you get the following notification that additional setup is required to enable debugging, confirm that you have the correct extensions installed and JavaScript preview debugging enabled and then reload the window:

* A notification offers to add the required assets to the app for building and debugging. Select **Yes**:

1. Starting the app in the debugger is a two-step process:
1\. **First**, start the app using the **.NET Core Launch (Blazor Standalone)** launch configuration.
2\. **After the app has started**, start the browser using the **.NET Core Debug Blazor Web Assembly in Chrome** launch configuration (requires Chrome). To use Edge instead of Chrome, change the `type` of the launch configuration in *.vscode/launch.json* from `pwa-chrome` to `pwa-msedge`.
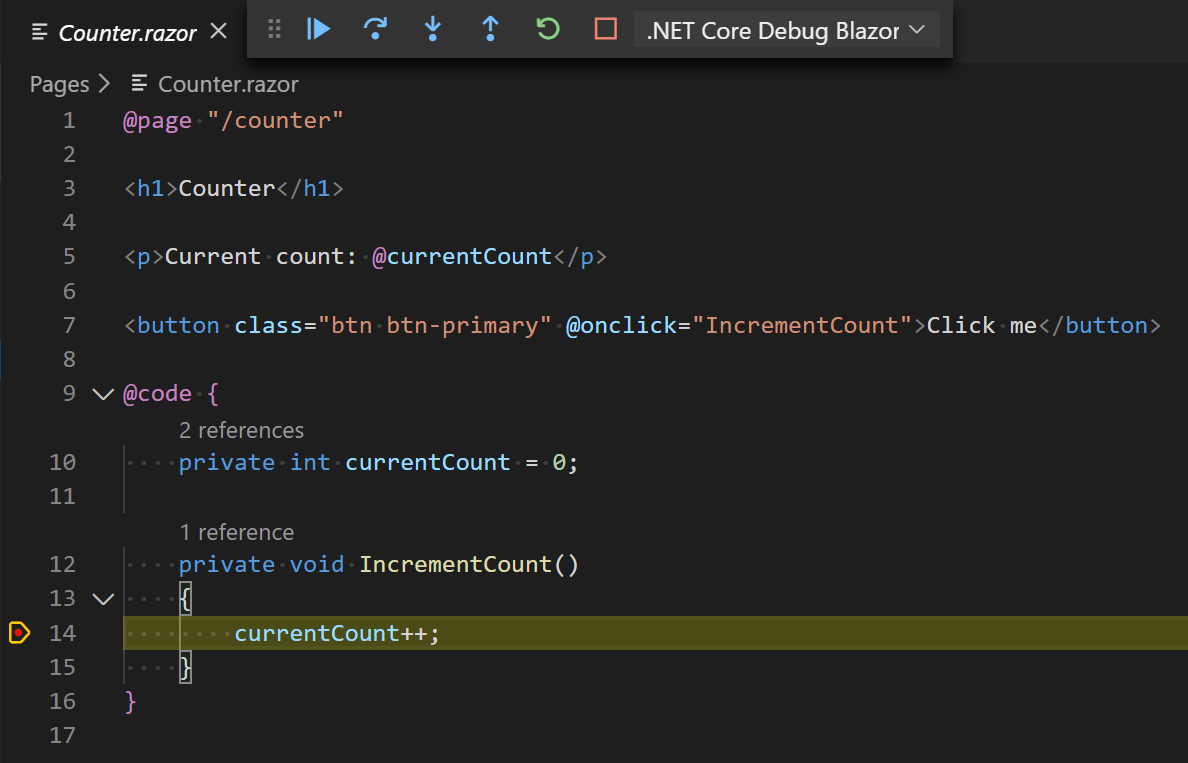
1. Set a breakpoint in the `IncrementCount` method in the `Counter` component and then select the button to hit the breakpoint:

## Debug in the browser
1. Run a Debug build of the app in the Development environment.
1. Press Shift+Alt+D.
1. The browser must be run with remote debugging enabled. If remote debugging is disabled, an **Unable to find debuggable browser tab** error page is generated. The error page contains instructions for running the browser with the debugging port open so that the Blazor debugging proxy can connect to the app. *Close all browser instances* and restart the browser as instructed.
Once the browser is running with remote debugging enabled, the debugging keyboard shortcut opens a new debugger tab. After a moment, the **Sources** tab shows a list of the .NET assemblies in the app. Expand each assembly and find the *.cs*/*.razor* source files available for debugging. Set breakpoints, switch back to the app's tab, and the breakpoints are hit when the code executes. After a breakpoint is hit, single-step (F10) through the code or resume (F8) code execution normally.
Blazor provides a debugging proxy that implements the [Chrome DevTools Protocol](https://chromedevtools.github.io/devtools-protocol/) and augments the protocol with .NET-specific information. When debugging keyboard shortcut is pressed, Blazor points the Chrome DevTools at the proxy. The proxy connects to the browser window you're seeking to debug (hence the need to enable remote debugging).
## Browser source maps
Browser source maps allow the browser to map compiled files back to their original source files and are commonly used for client-side debugging. However, Blazor doesn't currently map C# directly to JavaScript/WASM. Instead, Blazor does IL interpretation within the browser, so source maps aren't relevant.
## Troubleshoot
If you're running into errors, the following tip may help:
In the **Debugger** tab, open the developer tools in your browser. In the console, execute `localStorage.clear()` to remove any breakpoints.