3.7 KiB
| title | author | description | monikerRange | ms.author | ms.custom | ms.date | uid |
|---|---|---|---|---|---|---|---|
| Debug Razor Components | guardrex | Learn how to debug Blazor and Razor Components apps. | >= aspnetcore-3.0 | riande | mvc | 01/29/2019 | razor-components/debug |
Debug Razor Components
Razor Components has some very early support for debugging client-side Blazor apps running on WebAssembly in Chrome. While this initial debugging support is very limited and unpolished, it shows the basic debugging infrastructure coming together.
To debug a client-side Blazor app in Chrome:
- Build a Blazor app in
Debugconfiguration (the default for non-published apps). - Run the Blazor app in Chrome (version 70 or later).
- With the keyboard focus on the app (not in the dev tools panel, which you should probably close for a less confusing debugging experience), select the following Blazor-specific keyboard shortcut:
Shift+Alt+Don Windows/LinuxShift+Cmd+Don macOS
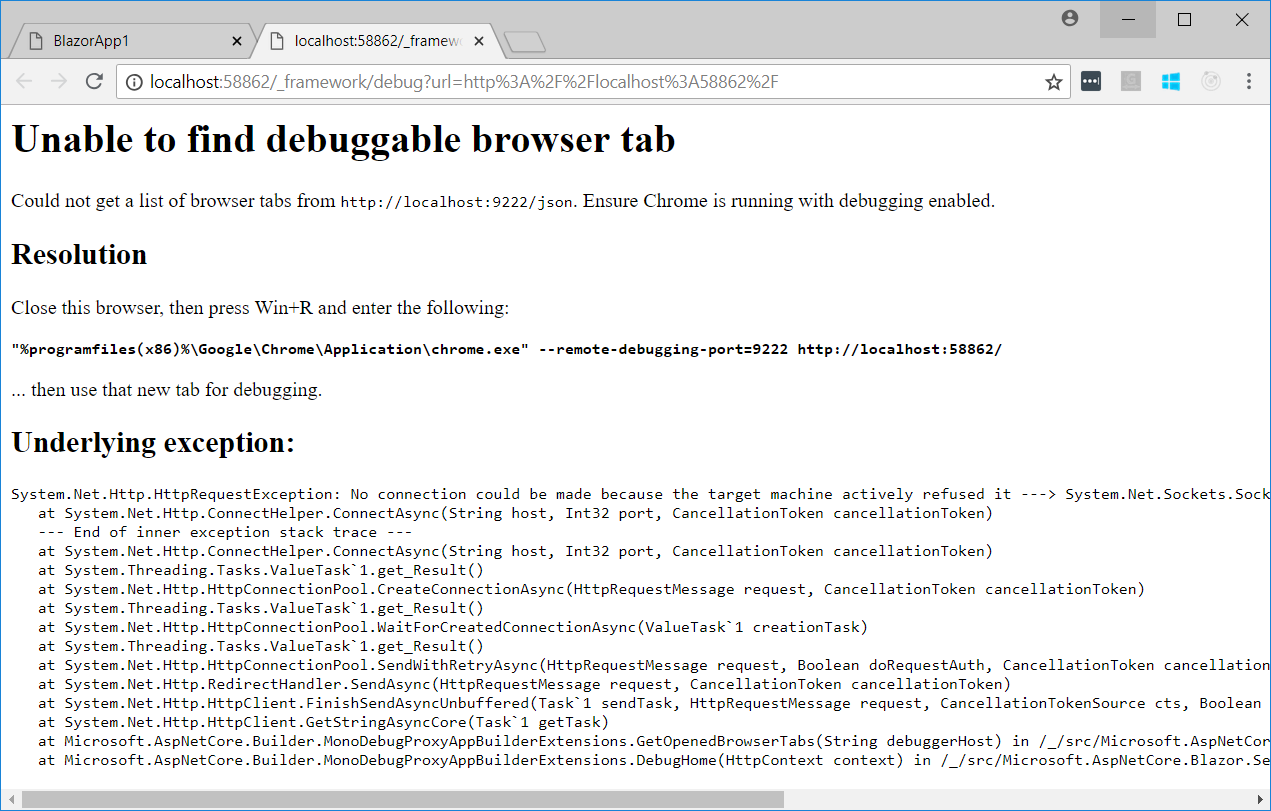
Run Chrome with remote debugging enabled to debug the Blazor app. If remote debugging is disabled, an error page is generated by Chrome. The error page contains instructions for running Chrome with the debugging port open so that the Blazor debugging proxy can connect to the app. Close all Chrome instances and restart Chrome as instructed.
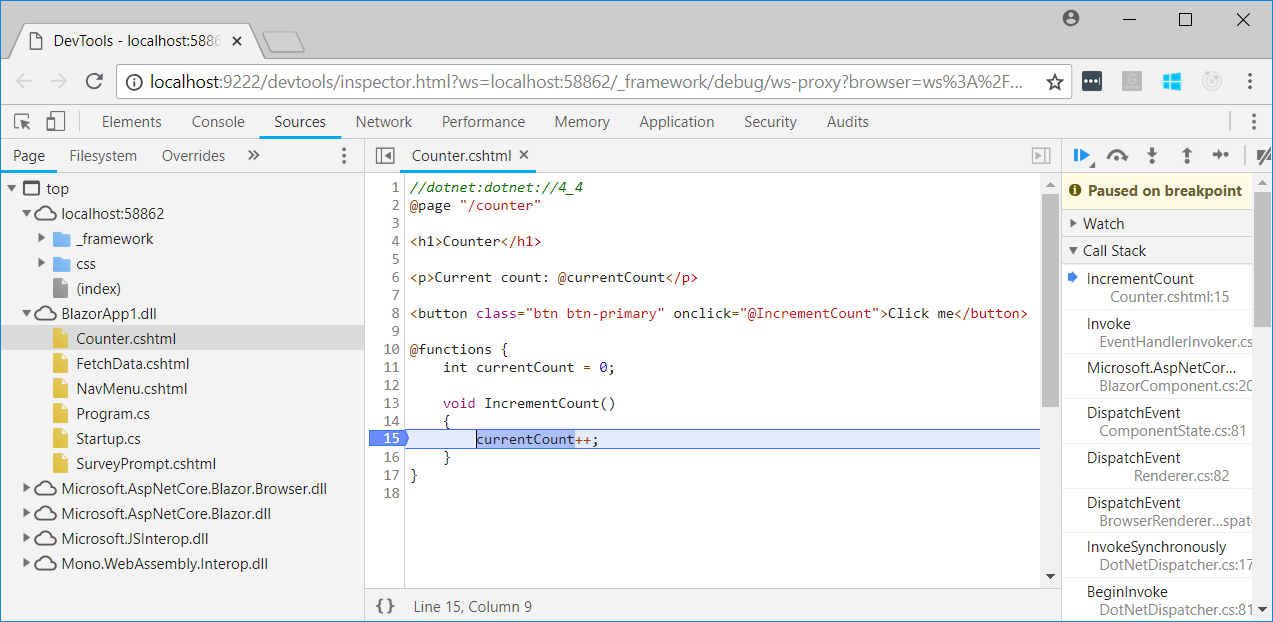
Once Chrome is running with remote debugging enabled, the debugging keyboard shortcut opens a new debugger tab. After a moment, the Sources tab shows a list of the .NET assemblies in the app. Expand each assembly and find the .cs/.cshtml source files available for debugging. Set breakpoints, switch back to the app's tab, and the breakpoints are hit. After a breakpoint is hit, single-step (F10) or resume (F8) normally.
Blazor provides a debugging proxy that implements the Chrome DevTools Protocol and augments the protocol with .NET-specific information. When debugging keyboard shortcut is pressed, Blazor points the Chrome DevTools at the proxy. The proxy connects to the browser window you're seeking to debug (hence the need to enable remote debugging).
You might be wondering why we don't just use browser source maps. Source maps allow the browser to map compiled files back to their original source files. However, Blazor does not map C# directly to JS/WASM (at least not yet). Instead, Blazor does IL interpretation within the browser, so source maps aren't relevant.
Note that the debugger capabilities are very limited. You can currently only:
- Set and remove breakpoints.
- Single-step through the code or resume (
F8). - In the Locals display, observe the values of any local variables of type
int,string, andbool. - See the call stack, including call chains that go from JavaScript into .NET and from .NET to JavaScript.
You can't:
- Observe the values of any locals that aren't an
int,string, orbool. - Observe the values of any class properties or fields.
- Hover over variables to see their values
- Evaluate expressions in the console.
- Step across async calls.
- Perform most other ordinary debugging scenarios.
Development of further debugging scenarios is an on-going focus of the engineering team.
Troubleshooting tip
If you're running into errors, the following tip may help:
In the debugger tab, open the developer tools in your browser. In the console, execute localStorage.clear() to remove any breakpoints.

